Graphviz
Thanks to this amazing tutorial, I learnt this very impressive tool to help us visualize things.
Example

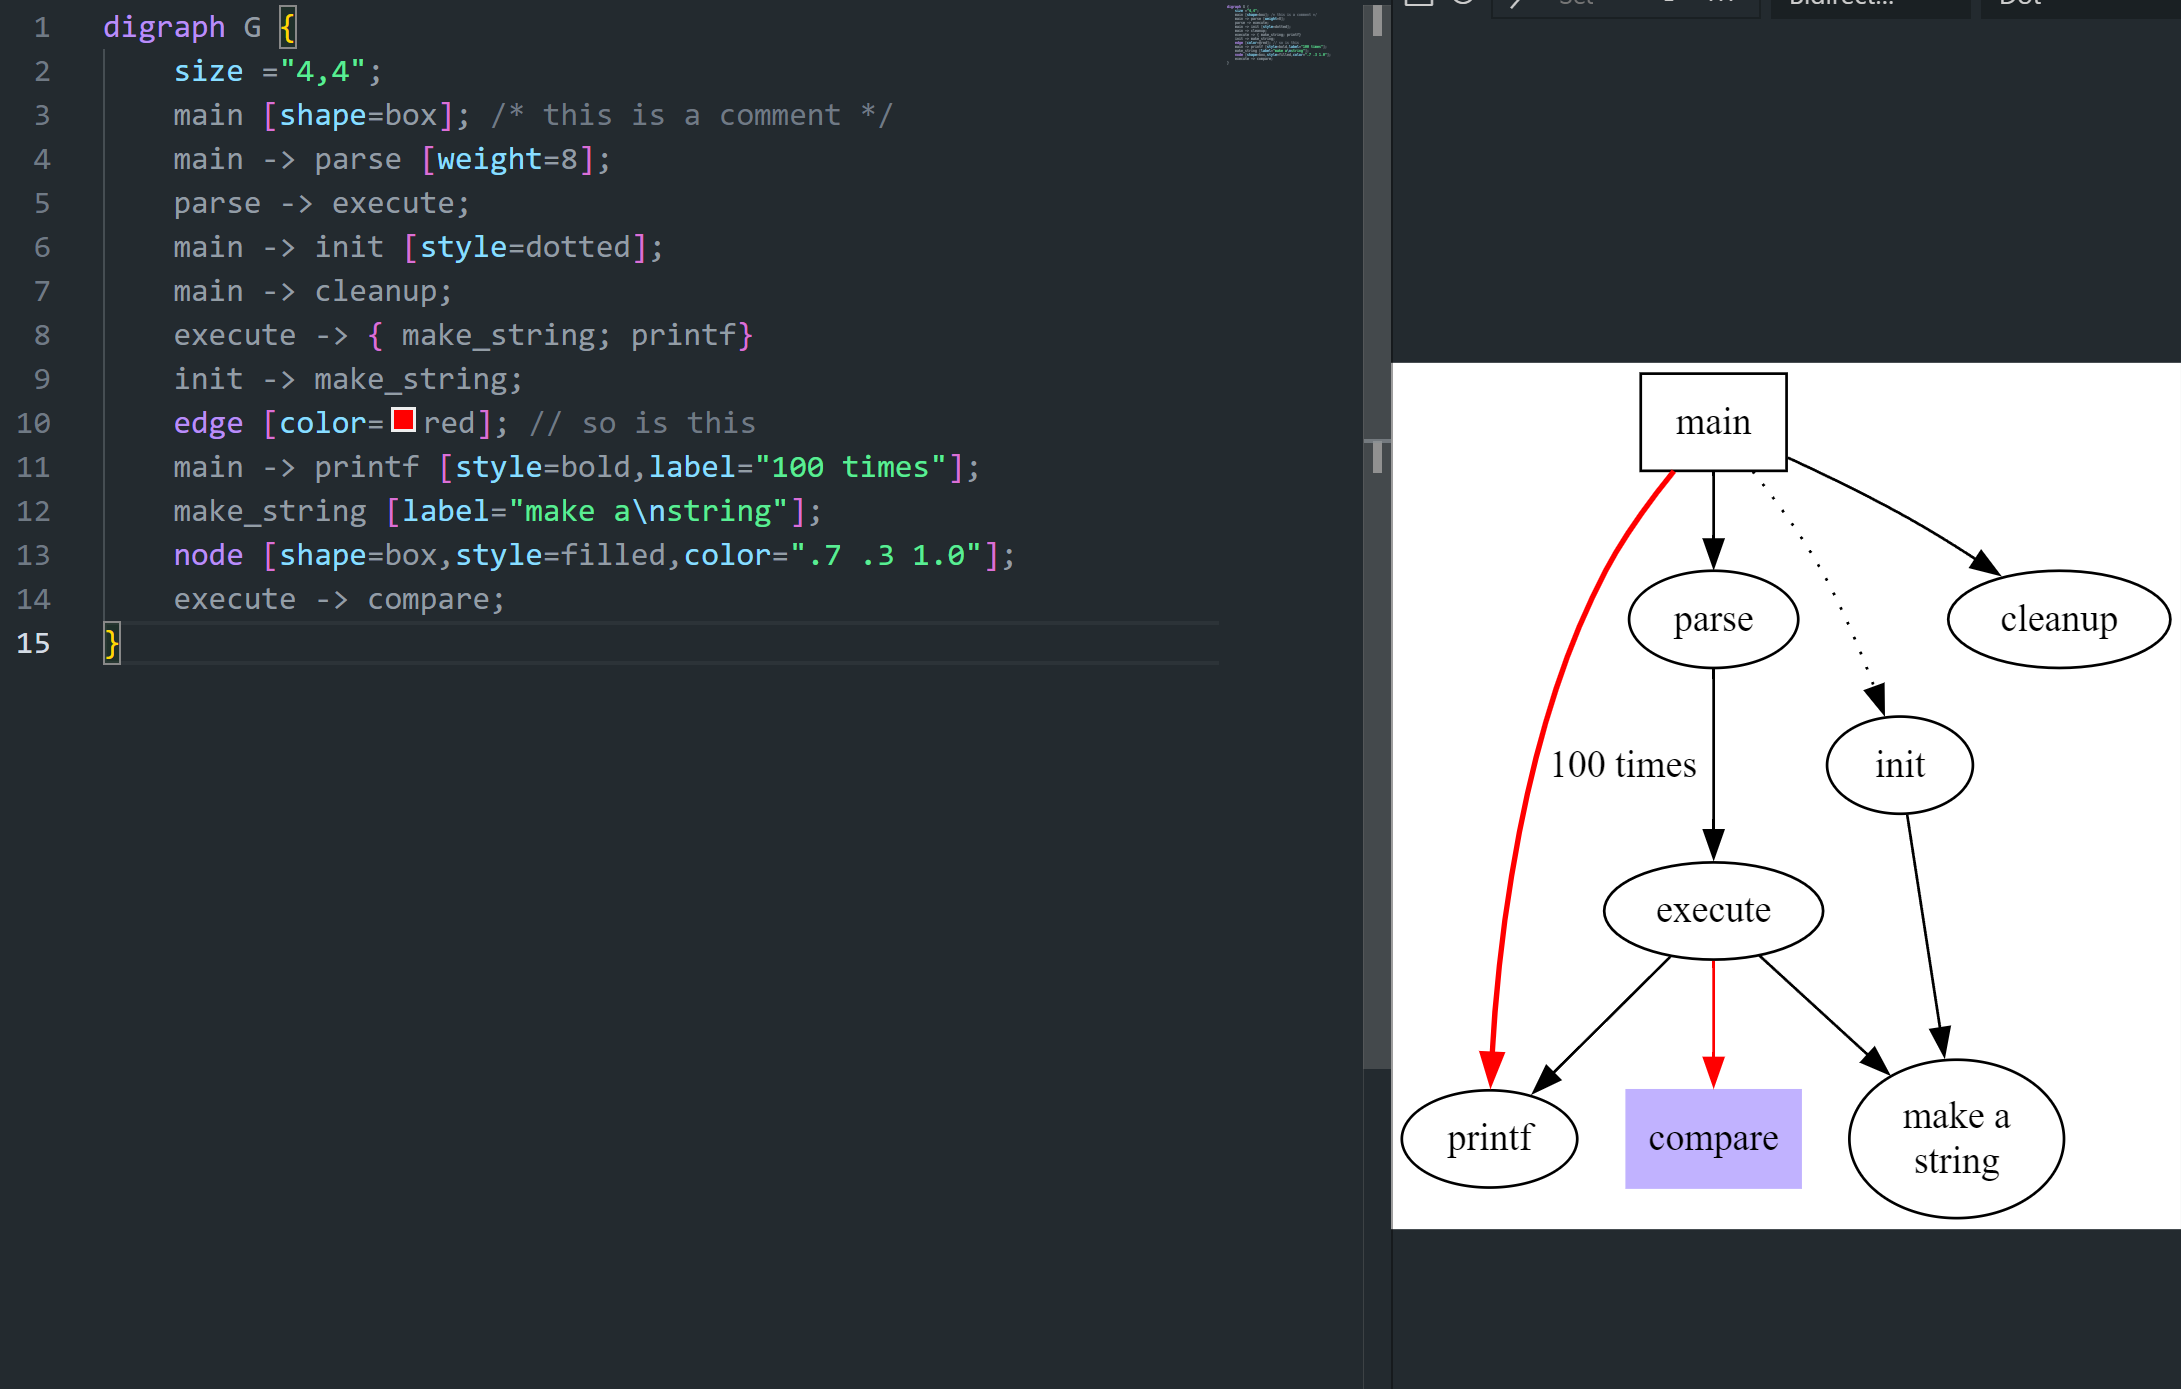
digraph G {
    size ="4,4";
    main [shape=box]; /* this is a comment */
    main -> parse [weight=8];
    parse -> execute;
    main -> init [style=dotted];
    main -> cleanup;
    execute -> { make_string; printf}
    init -> make_string;
    edge [color=red]; // so is this
    main -> printf [style=bold,label="100 times"];
    make_string [label="make a\nstring"];
    node [shape=box,style=filled,color=".7 .3 1.0"];
    execute -> compare;
}

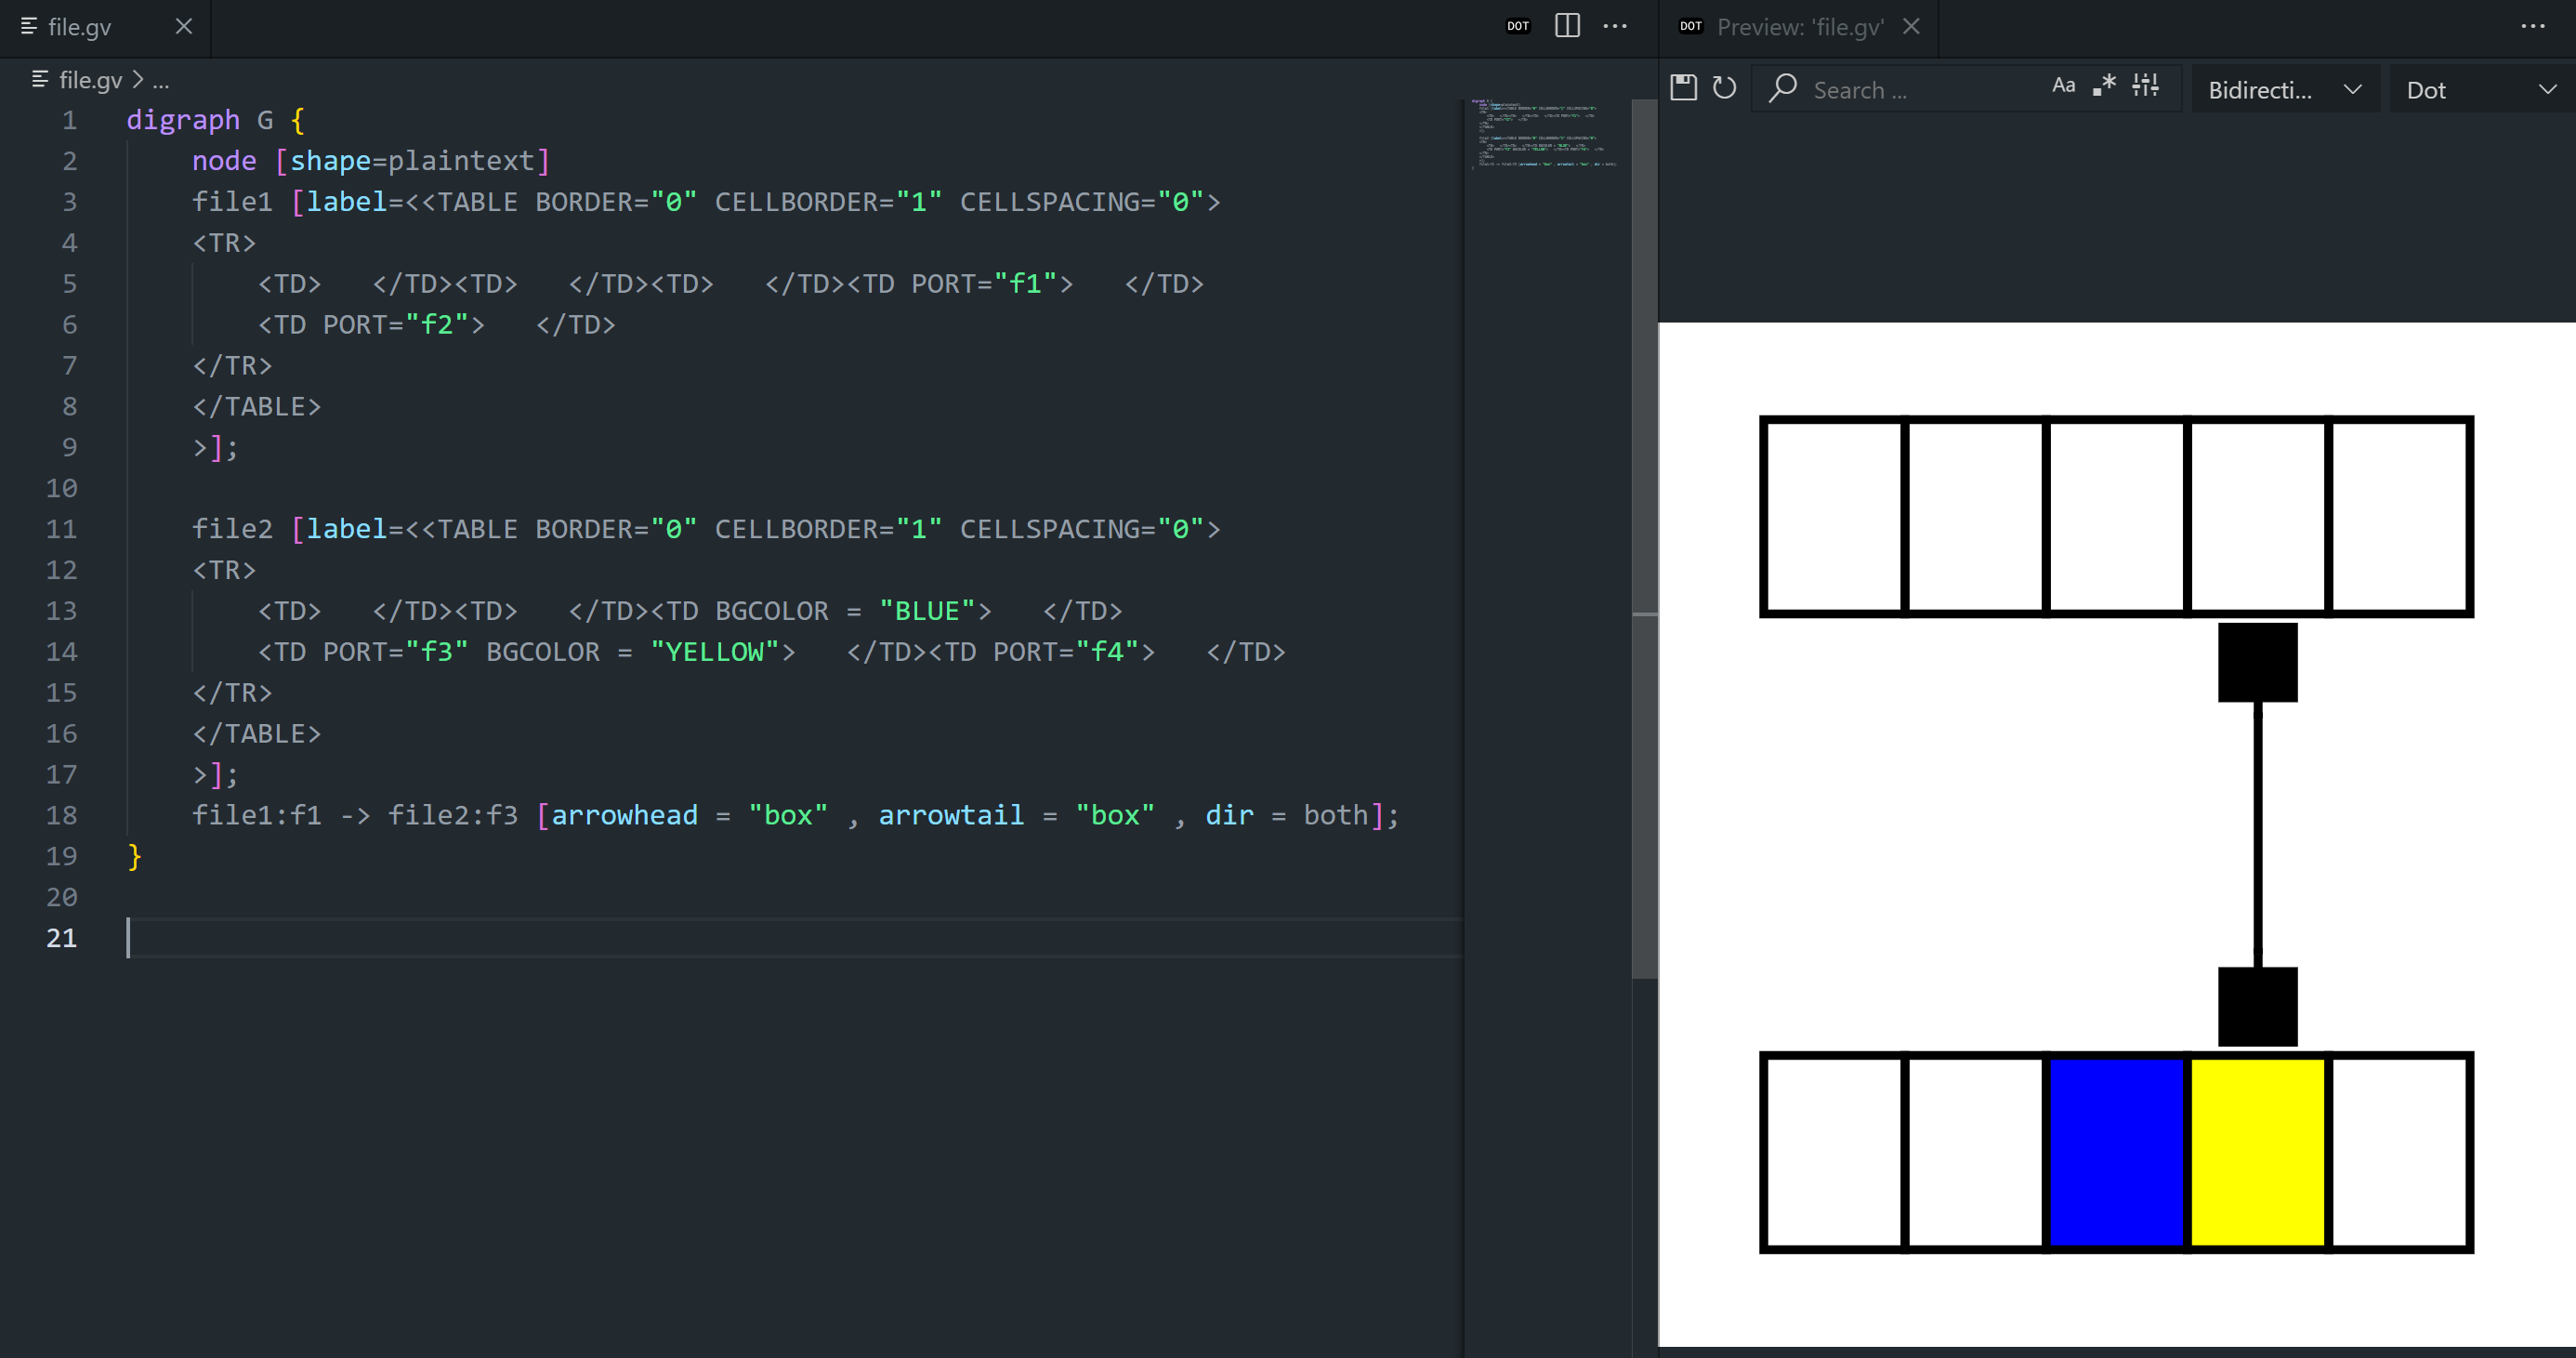
digraph G {
    node [shape=plaintext]
    file1 [label=<<TABLE BORDER="0" CELLBORDER="1" CELLSPACING="0">
    <TR>
        <TD>   </TD><TD>   </TD><TD>   </TD><TD PORT="f1">   </TD>
        <TD PORT="f2">   </TD>
    </TR>
    </TABLE>
    >];

    file2 [label=<<TABLE BORDER="0" CELLBORDER="1" CELLSPACING="0">
    <TR>
        <TD>   </TD><TD>   </TD><TD BGCOLOR = "BLUE">   </TD>
        <TD PORT="f3" BGCOLOR = "YELLOW">   </TD><TD PORT="f4">   </TD>
    </TR>
    </TABLE>
    >];
    file1:f1 -> file2:f3 [arrowhead = "box" , arrowtail = "box" , dir = both];
}

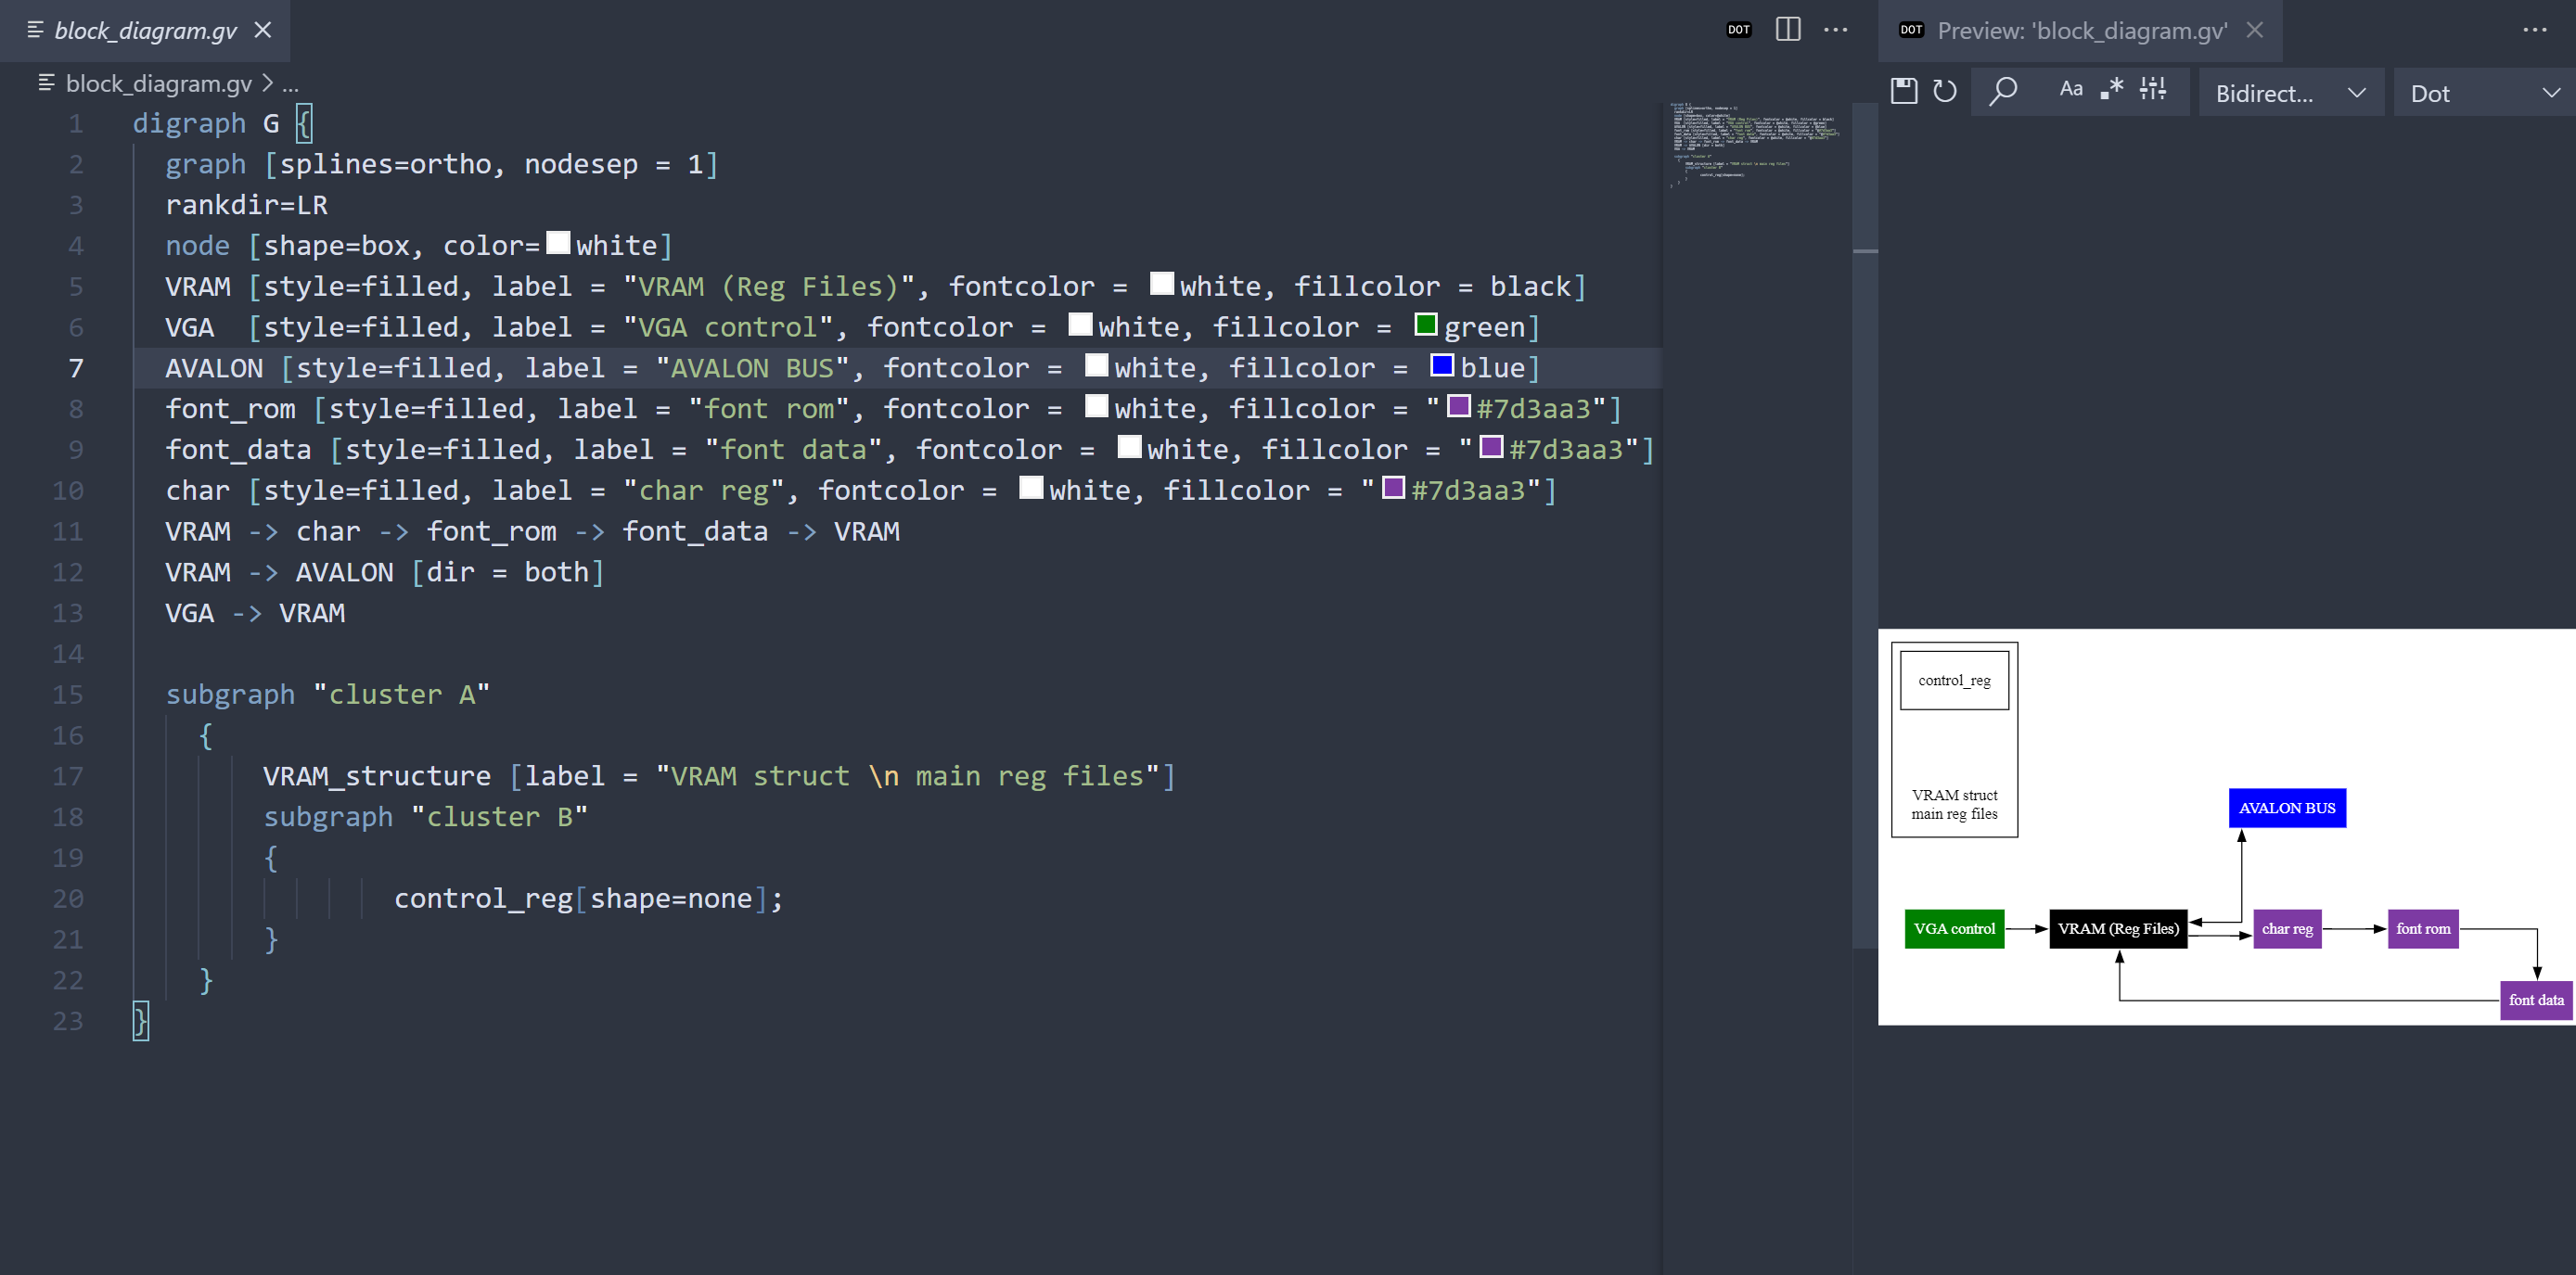
digraph G {
  graph [splines=ortho, nodesep = 1]
  rankdir=LR
  node [shape=box, color=white]
  VRAM [style=filled, label = "VRAM (Reg Files)", fontcolor = white, fillcolor = black]
  VGA  [style=filled, label = "VGA control", fontcolor = white, fillcolor = green]
  AVALON [style=filled, label = "AVALON BUS", fontcolor = white, fillcolor = blue]
  font_rom [style=filled, label = "font rom", fontcolor = white, fillcolor = "#7d3aa3"]
  font_data [style=filled, label = "font data", fontcolor = white, fillcolor = "#7d3aa3"]
  char [style=filled, label = "char reg", fontcolor = white, fillcolor = "#7d3aa3"]
  VRAM -> char -> font_rom -> font_data -> VRAM
  VRAM -> AVALON [dir = both]
  VGA -> VRAM

  subgraph "cluster A"
    {
        VRAM_structure [label = "VRAM struct \n main reg files"]
        subgraph "cluster B"
        {
                control_reg[shape=none];
        }
    }
}
About moomoohorse

Email : haor2@illinois.edu
Website : http://moomoohorse.com